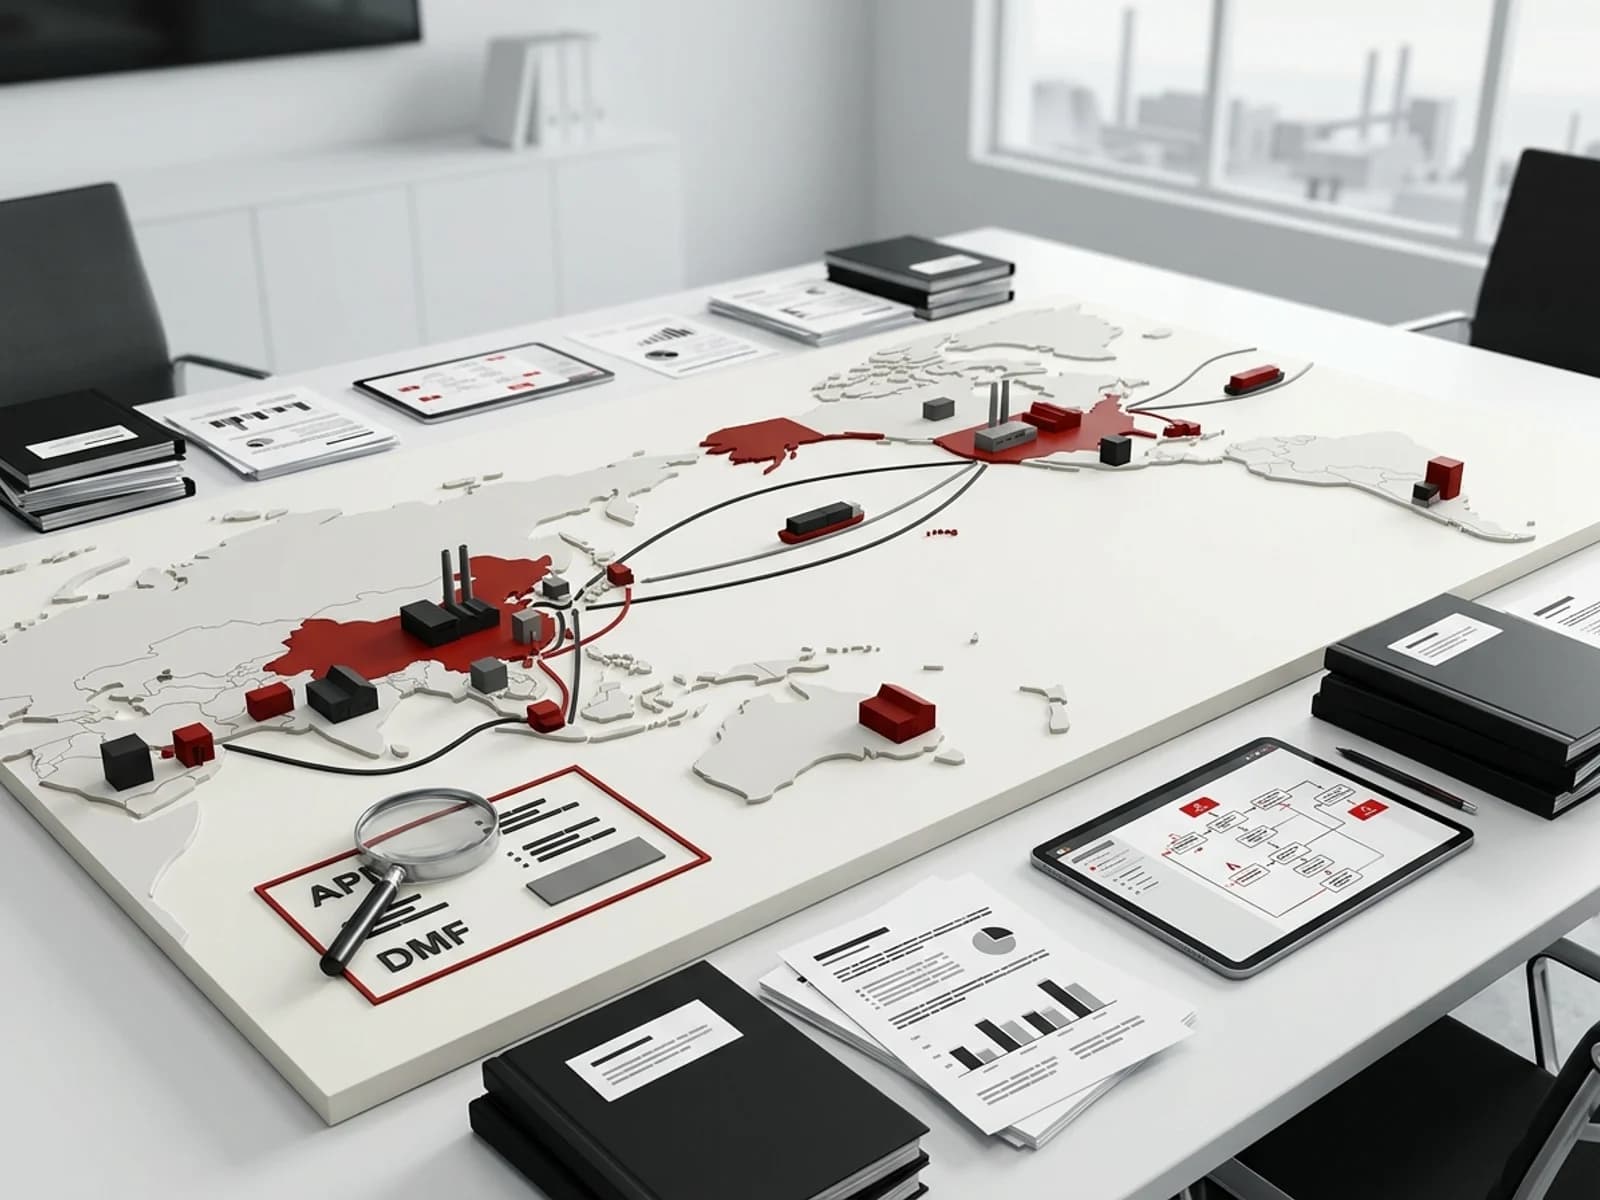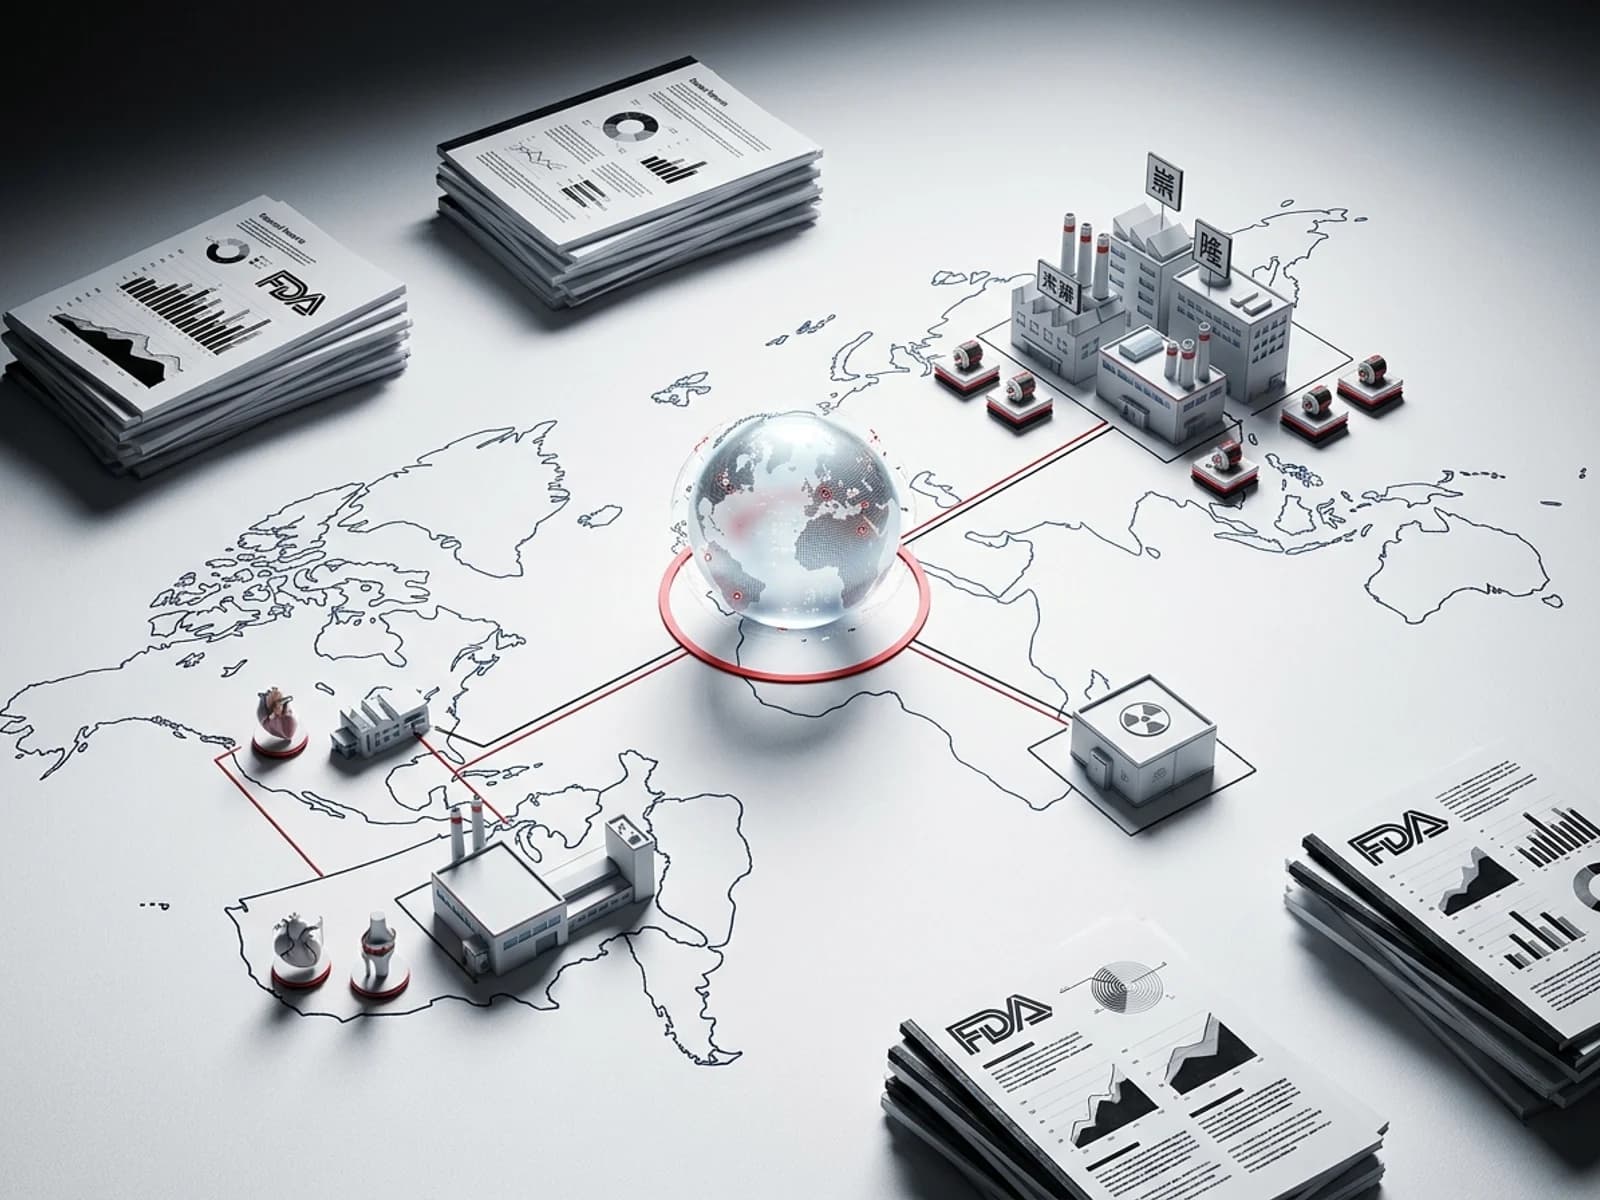
For medtech supply chain directors, combination-product operations leads, and biosecure-compliance officers, the geography of manufacturing is a critical dimension of operational risk. As geopolitical tensions rise and Congress debates legislative restrictions on foreign-sourced medical products, understanding where the U.S. device supply base is actually located is no longer just a regulatory filing requirement—it is a core business-continuity mandate.
For a supply chain leader mapping this terrain, the registry data reveals a deeply outsourced and geographically dispersed network. The FDA's establishment registration and listing database contains 419,261 establishment-product registration rows across 25,190 unique registered establishments (FEIs) and 21,844 unique owner-operators.
The first major finding is a clear geographic inversion: foreign establishments now command a majority (51.7%) of all FDA device listings compared to domestic U.S. operations (48.3%).
On a country-by-country basis, China has established itself as the undisputed #2 manufacturer for U.S. medical devices. Out of 419,261 product listing rows, China holds 47,757 listings (11.4%), trailing only the United States (202,307 listings / 48.3%) and commanding a substantial lead over traditional medtech hubs like Germany (25,617 / 6.1%), Switzerland (10,339 / 2.5%), and Mexico (10,013 / 2.4%).
From an operational standpoint, the data exposes the highly outsourced structure of device assembly. Registration listings for contract manufacturing (68,810 rows) and contract sterilization (39,184 rows) together rival the volume of own-site manufacturing (118,143 rows).
Within the U.S., California leads domestic operations with 29,351 listings, while Indiana (13,130) reflects a major orthopedics cluster centered in Warsaw, and Minnesota (8,702) represents the cardiac device cluster. In the FDA's Global Unique Device Identification Database (GUDID), which tracks 5,083,948 unique device identifiers (DIs), generic supply distributors Cardinal Health (370,347 DIs) and Medline (251,266 DIs) hold the largest portfolios, alongside a major concentration of orthopedic firms (such as Smith & Nephew, Alphatec, Medtronic Sofamor Danek, Nuvasive, Globus, Biomet, and Zimmer) occupying the top fifteen corporate spots.
How many FDA-registered device establishments are there, and are most foreign or domestic?
To assess the structure of the medical device supply chain, analysts must understand the hierarchy of the FDA's registration and listing database. Under 21 CFR Part 807, any facility that manufactures, prepares, propagates, compounds, assembles, or processes medical devices for commercial distribution in the U.S. must register annually with CDRH and secure a Food and Drug Administration Establishment Identifier (FEI) number. Furthermore, each registered establishment must list the specific medical devices (identified by product codes) that are processed at their site.
This creates three levels of data aggregation:
Owner-Operators: The parent corporate entities that own the facilities. The database contains 21,844 unique owner-operators.
Registered Establishments (FEIs): The physical facilities where manufacturing occurs. There are 25,190 unique registered establishments active in the registry.
Establishment-Product Rows: The specific facility-product pairings. Because a single facility typically manufactures or lists multiple device product codes, the database contains 419,261 active registration rows.
When we analyze these 419,261 registration rows by geographic location, the data reveals that the manufacturing base for U.S.-distributed devices has crossed a historic threshold:
Domestic vs. Foreign Share of FDA Device Listing Rows
| Region | Registration Rows | Share of Global Base |
|---|---|---|
| Domestic (US-based) listings | 202,307 | 48.3% |
| Foreign (non-US) listings | 216,954 | 51.7% |
This geographic inversion highlights the U.S. market's reliance on global supply networks. While major corporate headquarters and product developers remain heavily concentrated in the U.S., the physical execution of assembly, packaging, and sterilization has shifted abroad. (Note: these shares are row-weighted — a foreign site that lists many product codes inflates the foreign count; the unique-establishment split is close but not identical.)
For combination-product developers and specialty drug manufacturers, this global footprint introduces complex supply chain management challenges. A drug-delivery device constituent—such as an auto-injector casing or a specialized inhalation nozzle—often relies on sub-assembly and component molding performed at foreign sites. A single disruption at a foreign molding facility can halt combination product packaging in the U.S., triggering immediate shortages. To compare how this device manufacturing footprint aligns with global drug approval structures and domestic manufacturing shares in other markets, read our study on Canada drug approvals and domestic generic manufacturing baselines.
Which countries dominate FDA device establishment registrations (and how big is China's share)?
A country-by-country breakdown of the 419,261 registration rows reveals the specific geographic hubs that support the U.S. healthcare system. While the U.S. remains the largest single listing source, the remaining top spots are held by a mix of low-cost manufacturing centers and high-precision European medtech clusters.
The table below outlines the top fifteen countries by FDA medical device registration rows:
Top 15 Countries by FDA Medical Device Registration Rows (2026)
| Rank | Country | Registration Rows | Share of Global Base (%) | Primary Device Types & Clinical Focus |
|---|---|---|---|---|
| 1 | United States (US) | 202,307 | 48.25% | High-precision hardware, diagnostics, cardiovascular, orthopedics, custom implants. |
| 2 | China (CN) | 47,757 | 11.39% | Consumables, syringes, surgical drapes, personal protective equipment (PPE), electronic components, contract assembly. |
| 3 | Germany (DE) | 25,617 | 6.11% | High-grade surgical instruments, diagnostics, specialized imaging components, dental hardware. |
| 4 | Switzerland (CH) | 10,339 | 2.47% | Precision micromachining, orthopedic implants, drug-delivery components, dental implants. |
| 5 | Mexico (MX) | 10,013 | 2.39% | High-volume maquiladora assembly, catheter sets, IV administration tubing, surgical packs. |
| 6 | Canada (CA) | 9,465 | 2.26% | Software as a Medical Device (SaMD), diagnostics, custom orthotics, dental prosthetics. |
| 7 | United Kingdom (GB) | 8,415 | 2.01% | Wound care, diagnostic assays, orthopedic implants, neurological hardware. |
| 8 | India (IN) | 8,092 | 1.93% | Orthopedic implants, single-use surgical consumables, diagnostics, cardiovascular catheters. |
| 9 | South Korea (KR) | 8,035 | 1.92% | Dental implants, aesthetic lasers, IVD assay kits, ultrasound imaging systems. |
| 10 | Pakistan (PK) | 7,888 | 1.88% | Handheld surgical instruments (stainless steel forceps, scissors, retractors). |
| 11 | Japan (JP) | 7,732 | 1.84% | Endoscopes, high-resolution imaging sensors, cardiovascular guidewires, diagnostic systems. |
| 12 | France (FR) | 7,445 | 1.78% | Orthopedic implants, biological meshes, clinical chemistry assays. |
| 13 | Taiwan (TW) | 6,436 | 1.54% | Electric wheelchairs, blood glucose monitors, plastic medical consumables, electronic assemblies. |
| 14 | Netherlands (NL) | 6,005 | 1.43% | Vascular grafts, contract sterilization (ethylene oxide), diagnostic software. |
| 15 | Malaysia (MY) | 5,411 | 1.29% | Medical gloves (nitrile/latex), surgical condoms, catheter components. |
Data Source: openFDA Device Registration and Listing Database (as-of snapshot July 6, 2026).
The Supply-Chain Implications of China's Concentration
For supply chain compliance officers, the most critical number is China's 11.4% share of the U.S. registration base. With 47,757 listings, China holds nearly double the registration volume of Germany and more than four times the volume of Switzerland or Mexico.
This concentration creates immediate exposure to regulatory and legislative shifts. While the Biosecure Act has focused trade attention on pharmaceutical contract development and manufacturing organizations (CDMOs) like WuXi AppTec, the medical device sector is facing parallel scrutiny. Congress and federal agencies are increasingly evaluating "biosecure-supply" guidelines to reduce reliance on foreign-sourced medical hardware and raw materials.
China's dominance is concentrated in three areas:
Single-Use Consumables: Syringes, needles, IV connectors, and surgical drapes. These low-margin, high-volume items are almost entirely outsourced to Chinese manufacturers.
Contract Electronics: Printed circuit board assemblies (PCBAs) and sensors that power active medical devices (like infusion pumps and monitors).
Stainless Steel Instrumentation: Handheld surgical tools, often finished in China or neighboring Pakistan (which holds 7,888 listings, almost exclusively for handheld instruments).
If trade restrictions or tariffs are imposed on Chinese medical device manufacturers, U.S. hospitals and biopharma firms using combination products could face severe shortages. Replacing this capacity is not straightforward: while shifting assembly to Mexico (10,013 listings) is an option, Mexico's capacity is already highly utilized, and the country lacks the raw-material and component-molding infrastructure that supports China's medtech clusters. To see how these foreign-concentration supply chain dynamics compare to the active pharmaceutical ingredient (API) and drug master file (DMF) sectors, see our report on the Biosecure Act and biopharma API supply chain strategy.
What roles do registered establishments actually play — manufacture, contract, sterilize, export-only, spec-developer?
A major error in medtech market analysis is assuming that every FDA-registered facility performs complete, end-to-end device manufacturing. In reality, the medtech industry has adopted a highly fragmented, specialized, and outsourced structure.
By analyzing the establishment_type field in the registration registry, we can map the operational roles that facilities play. Out of 419,261 registration rows, the top roles are distributed as follows:
Manufacture Medical Device: 118,143 listings (Own-site manufacturing where the firm holds the regulatory clearance and performs the assembly).
Contract Manufacturer (Manufacture for Another Party): 68,810 listings (Third-party facilities that build devices under contract for other brand owners).
Contract Sterilizer (Sterilize for Another Party): 39,184 listings (Dedicated facilities that sterilize devices using ethylene oxide, gamma radiation, or electron beam).
Export-Only (Export to the US but perform no other operation): 36,431 listings (Foreign warehouses, consolidators, or exporters that manage logistics but do not alter the product).
Specification Developer (Develop Specs but do not manufacture): 32,499 listings (Virtual device companies that own the IP and regulatory clearances but outsource 100% of physical manufacturing).
Repack or Relabel Medical Device: 30,521 listings (Facilities that package bulk devices into clinical-ready kits or apply private labels).
This breakdown indicates that at least 25% of all active registration rows represent third-party contract operations (contract manufacturing and sterilization). If we include virtual "Specification Developers" who outsource their production, the outsourced share of the medtech supply chain exceeds 40%.
The Contract Sterilization Bottleneck
For biopharma and medtech operations, the 39,184 contract sterilization listings represent a critical supply chain bottleneck. The vast majority of sterile medical devices—including syringes, catheters, surgical kits, and implantable hardware—are sterilized using Ethylene Oxide (EtO).
EtO sterilization is highly concentrated in a small number of commercial facilities operated by firms like Sterigenics and Sotera Health. However, the Environmental Protection Agency (EPA) has implemented strict new emissions standards for EtO facilities to reduce commercial cancer risks. Meeting these standards requires facilities to install expensive air-scrubbing equipment, leading to temporary facility shutdowns, capacity constraints, and increased sterilization lead times.
Because device manufacturers cannot easily shift sterilization sites without filing formal PMA or 510(k) supplements to the FDA (as discussed in our companion piece on FDA device clearances and approvals by the numbers), any disruption at a contract sterilizer immediately backs up the entire manufacturing line. For an analysis of how contract manufacturing and sterilization bottlenecks impact broader sterile drug and injectable supply chains, see our guide on sterile injectable shortages and generic capacity entry.
Where in the US is device manufacturing concentrated (CA, IN, MA, MN)?
While foreign registrations command a majority of listings, the U.S. domestic manufacturing base remains a vital source of high-complexity hardware, cardiovascular systems, and orthopedic implants. By analyzing the U.S.-only registration cohort (202,307 rows), we can identify the states that dominate domestic medtech production.
The table below details the top ten U.S. states by registration rows:
Top 10 U.S. States by FDA Medical Device Registration Rows
| Rank | State | Registration Rows | Key Regional Medtech Clusters & Specialties |
|---|---|---|---|
| 1 | California (CA) | 29,351 | Silicon Valley digital health/robotics, Orange County cardiovascular (Edwards Lifesciences), San Diego diagnostics (Illumina). |
| 2 | Indiana (IN) | 13,130 | Warsaw Orthopedics Cluster: The global capital of orthopedic manufacturing, hosting major facilities for Zimmer Biomet, DePuy (J&J), and Medtronic. |
| 3 | Massachusetts (MA) | 12,767 | Boston Boston Scientific hub, robotics, high-complexity surgical hardware, and combination-product research labs. |
| 4 | Tennessee (TN) | 12,454 | Memphis spinal implant cluster (Medtronic Sofamor Danek, Smith & Nephew orthopedic headquarters). |
| 5 | Illinois (IL) | 12,405 | Chicago hospital supply manufacturing (Baxter Healthcare, Abbott Laboratories corporate corridor). |
| 6 | Florida (FL) | 12,053 | Jacksonville contact lens manufacturing (Johnson & Johnson Vision Care), surgical instrumentation assembly. |
| 7 | Pennsylvania (PA) | 11,076 | Diagnostic imaging components, clinical assay manufacturing, dental laboratory networks. |
| 8 | Texas (TX) | 10,940 | Houston cardiovascular research/assembly, Dallas orthopedic manufacturing. |
| 9 | New Jersey (NJ) | 9,346 | Franklin Lakes corridor (Becton Dickinson / BD diagnostics and syringes), cardiovascular component assembly. |
| 10 | Minnesota (MN) | 8,702 | Twin Cities Medical Alley: Cardiac rhythm management (CRM) cluster, anchoring major facilities for Medtronic, Boston Scientific, and Abbott (St. Jude). |
Data Source: openFDA Device Registration Database (US-only subset, July 6, 2026).
The Orthopedic and Cardiac Clusters
This state-level analysis highlights two highly specialized regional clusters:
The Warsaw, Indiana Orthopedics Cluster: Indiana holds 13,130 listings, almost entirely driven by the orthopedic manufacturing base in Warsaw, IN. This single town produces an estimated one-third of the world's joint replacement implants, creating a highly concentrated supply network of specialized metal forgers, precision machinists, and cleanroom packaging facilities.
Minnesota's Medical Alley: Minnesota's 8,702 listings are concentrated around the Twin Cities, which serve as the historic birthplace of cardiac rhythm management. This cluster was built around Medtronic's early pacemakers and now hosts extensive engineering networks specializing in implantable electronics, hermetic battery sealing, and biocompatible leads.
For biopharma operations, locating packaging or combination-product assembly sites near these established clusters provides immediate access to specialized contract engineering, testing laboratories, and regulatory consultants, reducing overall development lead times.
Which companies control the most device identifiers in GUDID, and what does the orthopedics concentration mean?
Beyond facility registrations, the FDA tracks individual device packaging variations through the Global Unique Device Identification Database (GUDID). Operated in partnership with the National Library of Medicine (NLM), GUDID stores the Device Identifier (DI) portion of the Unique Device Identifier (UDI) required on all medical device labels.
The GUDID registry contains 5,083,948 unique device identifiers. When we aggregate these DIs by the brand owner or listing company, we can identify the firms with the largest product catalogs in the U.S. healthcare system.
Top 10 Listed Companies in GUDID by Device Identifier Count
| Rank | Listing Company Name (GUDID Labeler) | Device Identifier (DI) Count | Share of GUDID Database (%) | Primary Product Portfolio Characteristics |
|---|---|---|---|---|
| 1 | Cardinal Health 200, LLC | 370,347 | 7.28% | High-volume hospital consumables, surgical kits, tubing, dressing sets, catheters. |
| 2 | Medline Industries, Inc. | 251,266 | 4.94% | General hospital supplies, gowns, sterile kits, custom procedure trays, consumables. |
| 3 | FGX International Inc. | 74,463 | 1.46% | Over-the-counter reading glasses and protective eyewear (listed as Class I devices). |
| 4 | ICU Medical, Inc. | 63,607 | 1.25% | Infusion pump consumables, IV administration sets, oncology compounding systems, cassettes. |
| 5 | Bauerfeind AG | 55,911 | 1.10% | Orthopedic braces, compression stockings, support knits, custom orthotics. |
| 6 | Smith & Nephew, Inc. | 53,675 | 1.06% | Advanced wound care dressings, orthopedic reconstruction implants, trauma plates, arthroscopy tools. |
| 7 | GBS Commonwealth Co., Ltd. | 50,195 | 0.99% | Specialized import/export consolidations, medical drapes, protective wear. |
| 8 | Alphatec Spine, Inc. | 47,278 | 0.93% | Spinal fixation systems, pedicle screws, interbody spacers, cervical plates. |
| 9 | Avid Medical, Inc. | 45,794 | 0.90% | Custom surgical procedure trays, sterile components, packing assemblies. |
| 10 | Medtronic Sofamor Danek, Inc. | 44,885 | 0.88% | Spinal implants, pedicle screws, spinal fusion biologics, surgical navigation tools. |
Data Source: FDA/NLM AccessGUDID Database (July 6, 2026 snapshot).
Decoding the Orthopedic DI Concentration
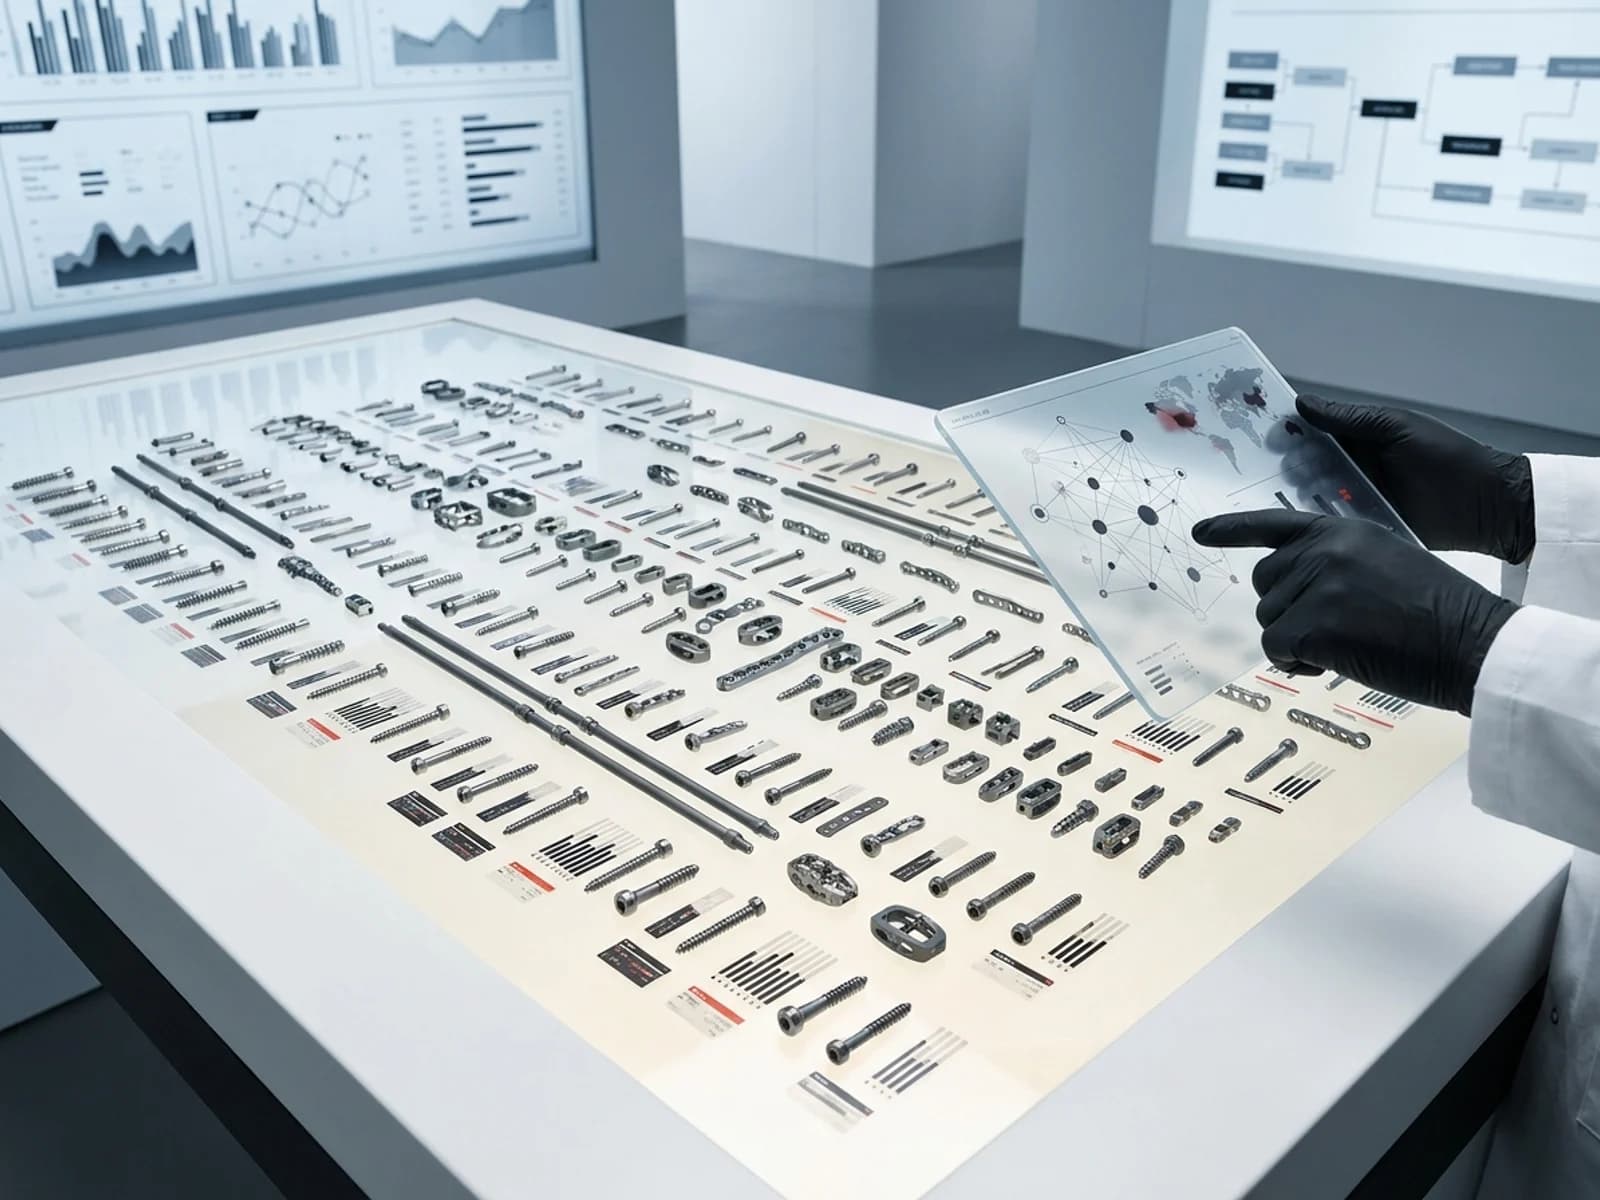
For analysts reviewing this leaderboard, the presence of orthopedic firms (Smith & Nephew, Alphatec, and Medtronic Sofamor Danek in the top ten, alongside Nuvasive at 44,509 DIs, Globus Medical at 43,178 DIs, Zimmer at 32,667 DIs, and Biomet at 41,994 DIs in the top fifteen) represents a striking structural trend.
Why do orthopedic companies hold more device identifiers than massive cardiovascular or diagnostics firms?
Component and Size Variations: A single spinal fixation system or hip replacement platform requires hundreds of individual size variations to match human anatomy. A manufacturer must list a separate Device Identifier for every screw length, diameter, thread pitch, plate angle, and joint insert thickness.
Instrument Kit Complexity: Orthopedic surgeries rely on large "loaner trays" containing specialized surgical instruments (screws inserters, taps, drills, trials) that are delivered to the hospital and sterilized before surgery. Every individual reusable instrument in these trays must carry its own UDI and DI listing, multiplying the firm's total DI count.
In contrast, a high-volume cardiovascular product like an implantable pacemaker or a transcatheter aortic valve requires only a few size models, keeping the manufacturer's GUDID DI footprint relatively small, even if their market revenue is substantial.
For supply chain and hospital procurement teams, managing this massive volume of orthopedic DIs requires robust enterprise resource planning (ERP) systems. The implementation of barcode scanning at the point of care relies on these GUDID records to automatically log device usage in electronic health records (EHR) and charge-capture systems, making database hygiene a critical priority for both hospital IT and medtech labeling teams. To see how these premarket GUDID catalogs translate into post-market quality and recall tracking, read our guide on FDA drug and device recall lookup workflows for pharmacy and supply chain teams.
Frequently Asked Questions
How many medical device establishments are registered with the FDA?
The FDA database contains 25,190 unique active registered establishments (FEIs) owned by 21,844 unique owner-operators. These facilities list a combined 419,261 establishment-product registration rows.
Are most FDA-registered device establishments located in the US or abroad?
Foreign establishments command a majority of listings in the FDA registration database, representing 51.7% of all active establishment-product rows (216,954 rows) compared to 48.3% for domestic U.S. operations (202,307 rows).
How many FDA-registered device establishments are in China?
China is the second-largest country by registration volume, holding 47,757 listings (11.4% of the global base). It trails only the United States (48.3%) and holds nearly double the registration volume of third-place Germany (6.1%).
What is the difference between a device manufacturer and a contract manufacturer / contract sterilizer in FDA registration?
A manufacturer is the brand owner that holds the regulatory clearance and performs assembly at their own facility. A contract manufacturer is a third-party facility that builds devices under contract for other brand owners. A contract sterilizer is a specialized facility that performs sterilizations (typically using Ethylene Oxide or radiation) under contract, serving as a critical supply chain bottleneck.
What is GUDID and how many device identifiers does it contain?
GUDID (Global Unique Device Identification Database) is a public registry operated by the FDA and the National Library of Medicine that stores the Device Identifier (DI) portion of the unique barcode required on all medical device labels. The database contains 5,083,948 unique device identifiers, led by hospital supply distributors and orthopedic implant manufacturers.
Sources
U.S. Food and Drug Administration (FDA). Establishment Registration and Device Listing Program Page. FDA Device Registration
U.S. Food and Drug Administration (FDA) / National Library of Medicine (NLM). AccessGUDID Public Database Portal. AccessGUDID Portal
U.S. Food and Drug Administration (FDA). Unique Device Identification System (UDI System) Guidelines. FDA UDI System
openFDA Medical Device Database API. Registration & Listing and UDI Endpoint Exports (July 6, 2026). openFDA API
U.S. Code of Federal Regulations. 21 CFR Part 807 — Establishment Registration and Device Listing for Manufacturers and Initial Importers. 21 CFR Part 807
U.S. Environmental Protection Agency (EPA). Clean Air Act Chemical Safety Standards for Ethylene Oxide Commercial Sterilizers. EPA EtO Regulations
Medical Alley Association. Minnesota's Medical Alley health-technology cluster and industry overview. Medical Alley Association