In mid-August 2026, the U.S. Bureau of Labor Statistics (BLS) published its Consumer Price Index (CPI) report for July 2026, sparking a national wave of headlines. The data showed that the prescription drug price index dropped 0.8% from June to July and fell 3.1% over the preceding 12 months — both on a not-seasonally-adjusted basis, because BLS does not seasonally adjust the prescription drugs series.
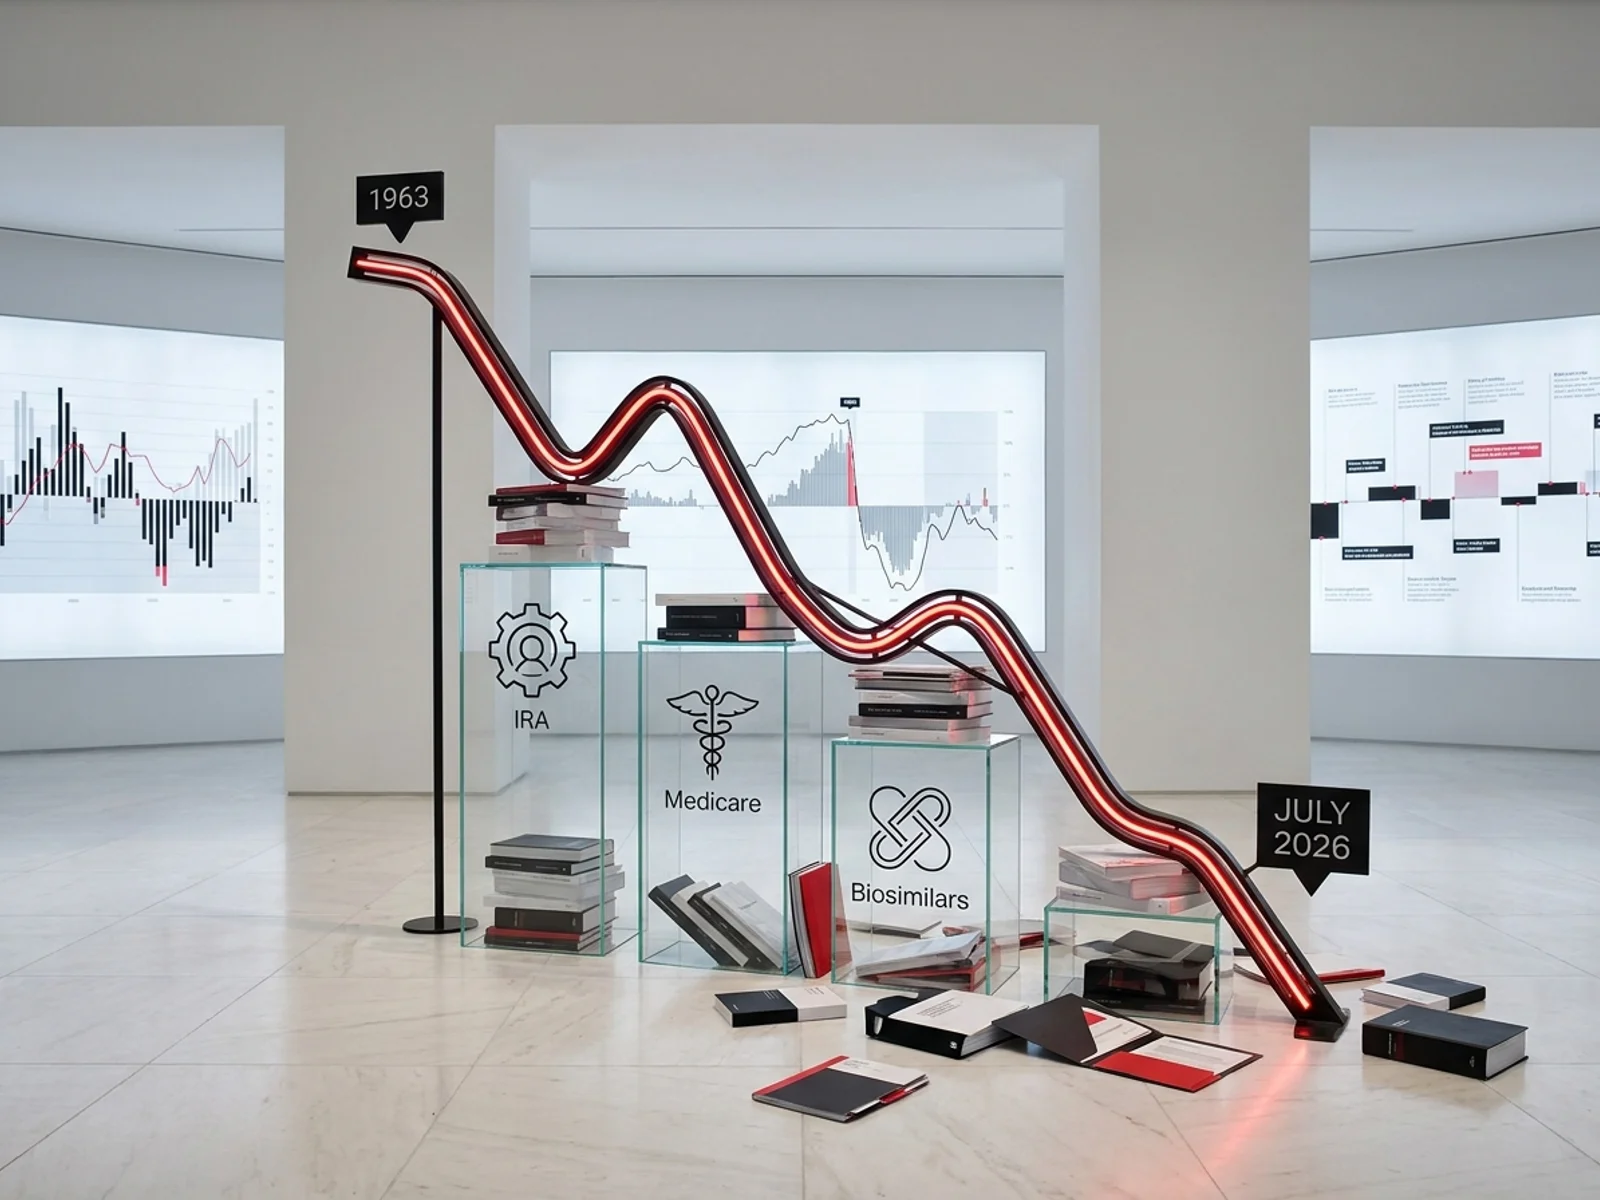
Crucially, the official BLS news release itself confirmed that this 3.1% annual decline represents the steepest 12-month drop in prescription drug prices since March 1963, when the index registered a 3.2% drop.
The release immediately ignited fierce political and commercial debate. The White House published a statement claiming credit for the "largest prescription drug price drop in over 60 years," attributing the decline to its Most Favored Nation (MFN) drug pricing framework covering 17 major pharmaceutical manufacturers and the TrumpRx cash-pay platform. Meanwhile, congressional critics and independent health economists pointed out that the timeline of the index's decline coincides directly with the implementation of the Inflation Reduction Act of 2022 (IRA; P.L. 117-169), major biosimilar market entries, and the redesign of Medicare Part D.
For biopharma pricing executives, market-access directors, health-system pharmacy leaders, and healthcare analysts, making sense of this data requires stripping away the political rhetoric and answering three structural questions:
What does the CPI prescription drug index actually measure—and what does it omit?
Which policies and market events had legal effective dates inside the July 2025 to July 2026 measurement window?
Why do aggregate price indices frequently diverge from the actual out-of-pocket costs paid by insured patients at the pharmacy counter?
What exactly fell 3.1 percent—and since when is that the steepest drop?
The headline numbers originate in the official BLS Consumer Price Index News Release for July 2026 (published August 12, 2026). In the detailed breakdown of consumer expenditures, prescription drugs occupy a specific sub-index within the Medical Care Commodities category:
| BLS CPI Table & Series | Metric / Category | July 2026 Value | Historical Benchmark / Notes |
|---|---|---|---|
| Table 2 (Relative Importance) | Prescription Drugs Weight in CPI-U | 0.919% | Represents ~0.92% of total consumer basket spending |
| Table 2 & Table 7 (12-Month NSA) | 12-Month Change (Unadjusted) | -3.1% | Steepest annual drop in the series in over 63 years |
| Table 6 & Table 2 (1-Month NSA) | 1-Month Change (Not Seasonally Adjusted) | -0.8% | Month-over-month decline from June to July 2026; BLS publishes the prescription drugs series NSA only |
| Table 7 (Historical Analysis Flag) | Prior Largest 12-Month Decrease | -3.2% (March 1963) | Official BLS historical series record (S-Mar. 1963) |
The claim that this is the "steepest drop since 1963" is not a political talking point or a journalistic extrapolation; it is an official table-level calculation embedded directly in BLS Table 7. Prior to the July 2026 report, prescription drug prices had not experienced a sustained 12-month deflationary move exceeding 3% since the Kennedy administration.
                      12-MONTH PRESCRIPTION DRUG CPI TRAJECTORY
  % Change
   +4.0% ──┐
           │                                          Typical Historical Trend (+2% to +4%/yr)
   +2.0% ──┼──────────────────────────────────────────────────────────
           │
    0.0% ──┼──────────────────────────────────────────────────────────
           │
   -1.0% ──┼─────────────────────────┐
           │                         │
   -2.0% ──┼─────────────────────────┼──────────────────┐
           │                         │                  │
   -3.0% ──┼─────────────────────────┼──────────────────┼──────────────▼ July 2026 (-3.1%)
   -4.0% ──┴─────────────────────────┴──────────────────┴──────────────
             Historical Normal       Late 2025 Shift     July 2026 BLS Release
                                                        (Steepest since Mar 1963: -3.2%)
What does the CPI prescription-drug index actually measure (and what does it miss)?
To evaluate which policies could have caused this decline, one must first understand the precise economic concept that the Bureau of Labor Statistics samples.
Many commentators conflate the CPI prescription drug index with wholesale acquisition cost (WAC), net manufacturer revenue, or patient out-of-pocket copayments. In reality, the BLS methodology captures a distinct transaction:
┌──────────────────────────────────────────────────────────────────────────────────┐
│                      WHAT THE CPI DRUG INDEX ACTUALLY MEASURES                   │
├──────────────────────────────────────────────────────────────────────────────────┤
│                                                                                  │
│   [ Patient Copay / Coinsurance ]  +  [ Insurer / Third-Party Payment ]          │
│                                                                                  │
│   = TOTAL TRANSACTION AMOUNT RECEIVED BY THE DISPENSING PHARMACY                 │
│                                                                                  │
└────────────────────────────────────────┬─────────────────────────────────────────┘
                                         │
                 ┌───────────────────────┴───────────────────────┐
                 ▼                                               ▼
   ┌───────────────────────────┐                   ┌───────────────────────────┐
   │    WHAT IS INCLUDED       │                   │    WHAT IS EXCLUDED       │
   ├───────────────────────────┤                   ├───────────────────────────┤
   │ • Retail pharmacy sales   │                   │ • Retrospective PBM       │
   │ • Mail-order pharmacy     │                   │   manufacturer rebates    │
   │ • Insured claims          │                   │ • Part B / Buy-and-bill   │
   │   (Commercial, Part D)    │                   │   physician-administered  │
   │ • Cash-pay transactions   │                   │ • Hospital inpatient meds │
   │ • Point-of-sale discounts │                   │ • Uninsured patient PAPs  │
   └───────────────────────────┘                   └───────────────────────────┘
According to the BLS Handbook of Methods chapter on the Consumer Price Index, the CPI prescription drug index measures the full transaction price paid to retail and mail-order pharmacies for a specific prescription drug product, combining the patient's out-of-pocket payment and the third-party insurer's reimbursement.
1. Inclusion of Third-Party Insurer Payments
Unlike general consumer goods where the shopper pays 100% of the shelf price, prescription medications in the United States are predominantly paid by third-party payers (commercial health plans, Medicare Part D plans, or Medicaid managed care organizations). When a pharmacy dispenses a 30-day supply of a brand-name drug with a $1,000 retail price, where the patient pays a $40 copay and the insurer pays the pharmacy $960, the BLS records the $1,000 combined transaction price, not merely the $40 copay. If a policy reduces the pharmacy reimbursement rate from $1,000 to $600, the index registers a 40% price drop even if the patient's $40 copay remains completely unchanged.
2. Exclusion of Retrospective Manufacturer Rebates
The BLS collects point-of-sale transaction data from pharmacy records and claims aggregators. It does not capture retrospective, post-sale rebates paid months later by drug manufacturers to Pharmacy Benefit Managers (PBMs) or plan sponsors. Therefore, if a brand-name drug's list price remains flat while the manufacturer pays a higher back-end rebate to secure formulary placement, the CPI index registers zero change. Conversely, if a policy forces an upfront reduction in the point-of-sale transaction price (such as statutory price ceilings or lower benchmark acquisition costs), that reduction is captured directly by the CPI.
3. Exclusion of Physician-Administered (Part B) Drugs
The CPI prescription drug index is restricted to outpatient prescription drugs dispensed through retail, specialty, and mail-order pharmacies. It does not measure physician-administered biologics, infused oncology drugs, or inpatient hospital pharmaceuticals reimbursed under Medicare Part B or commercial medical benefits.
Which policies have effective dates inside the July 2025–July 2026 window?
To establish causation, market analysts must map every major federal drug pricing policy, legislative change, and competitive milestone against their statutory effective dates. A policy cannot move the July 2026 12-month price index if its operational pricing mechanisms were not active in pharmacy transaction data between July 1, 2025, and July 31, 2026.
| Policy / Market Event | Legal Authority / Driver | Statutory Effective Date | Status Inside July 2025–July 2026 Index Window | Plausibility & Impact on CPI |
|---|---|---|---|---|
| IRA Initial Price Applicability Year (IPAY) 2026 | 42 U.S.C. § 1320f-1 (Inflation Reduction Act) | January 1, 2026 | Active for 7 months (Jan–Jul 2026) | High / Primary Driver: Maximum Fair Prices (MFPs) took effect for the top 10 highest-spend Part D drugs, slashing upfront Medicare pharmacy reimbursement rates by 38% to 79%. |
| Part D Benefit Redesign & $2,000 Out-of-Pocket Cap | 42 U.S.C. § 1395w-102 (IRA § 11201) | Jan 1, 2025 & Jan 1, 2026 | Active throughout the entire 12-month window | High: Eliminated the coverage gap ("donut hole"), capped patient costs, and restructured manufacturer discount liabilities at the point of sale. |
| Stelara & Humira Biosimilar Price Erosion | BPCIA / Public Health Service Act § 351(k) | Phased launches 2024–2025 | Active throughout the entire 12-month window | Moderate-High: Major market share shift toward lower-WAC biosimilars for blockbuster immunology biologics. |
| Medicare GLP-1 Bridge Program | HHS / CMS Demonstration Authority | July 1, 2026 | Active for exactly 1 month (July 2026) | Moderate / Monthly Move: Established a $50 copay model for eligible Part D beneficiaries starting July 1, contributing to the -0.8% July monthly drop. |
| Most Favored Nation (MFN) Voluntary Frameworks | Executive Orders / Voluntary Commitments | Announced late 2025 / 2026 | Contracts unpublished; demonstration models unimplemented | Low: Voluntary agreements with 17 manufacturers remain in regulatory development and have not altered commercial pharmacy dispensing contracts. |
| TrumpRx Platform | Executive Initiative / Direct-to-Consumer Cash Pay | Phased launch early 2026 | Active, but sits outside insured pharmacy claims | Low / Minimal: Direct cash-pay transactions for self-pay patients represent a minor fraction of the national prescription drug expenditure basket. |
When viewed through the lens of legal effective dates, the structural forces capable of moving a national price index by 3.1% in a 12-month period are overwhelmingly concentrated in statutory IRA price effectuation, Medicare Part D structural changes, and generic/biosimilar substitution.
Could the IRA negotiated prices really show up in a consumer price index?
A central question for healthcare economists is whether Medicare-specific negotiated prices are large enough to move the overall national CPI.
The answer lies in the massive expenditure weighting of the first 10 selected drugs. Under IRA Medicare drug price negotiation, the Maximum Fair Prices (MFPs) established for Initial Price Applicability Year (IPAY) 2026 took effect on January 1, 2026. These 10 products—including Eliquis, Jardiance, Xarelto, Januvia, Farxiga, Entresto, Enbrel, Imbruvica, Stelara, and Fiasp/NovoLog—accounted for over $50.5 billion in gross Medicare Part D spending in 2023 alone, representing roughly 20% of total Part D prescription expenditure.
IRA IPAY 2026 SELECTED DRUGS: POINT-OF-SALE PRICE DROPS
| Drug Name | Primary Indication | List Price (2023) | 2026 MFP Ceiling |
|---|---|---|---|
| **Eliquis** | Anticoagulant | $521 / 30-day | **$231 (-56%)** |
| **Jardiance** | Diabetes / HF / CKD | $573 / 30-day | **$197 (-66%)** |
| **Xarelto** | Anticoagulant | $517 / 30-day | **$197 (-62%)** |
| **Januvia** | Type 2 Diabetes | $527 / 30-day | **$113 (-79%)** |
| **Farxiga** | Diabetes / HF / CKD | $556 / 30-day | **$178 (-68%)** |
| **Entresto** | Heart Failure | $628 / 30-day | **$295 (-53%)** |
| **Enbrel** | Immunology | $7,106 / 30-day | **$2,355 (-67%)** |
| **Imbruvica** | Oncology | $14,934 / 30-day | **$9,319 (-38%)** |
| **Stelara** | Immunology | $13,836 / 30-day | **$4,695 (-66%)** |
| **Fiasp/NovoLog** | Diabetes (Insulin) | $495 / 30-day | **$119 (-76%)** |
Because Medicare Part D accounts for roughly 30% of U.S. retail prescription volume (and a somewhat larger share of retail prescription spending), an overnight 38% to 79% reduction in the statutory point-of-sale reimbursement rates for 10 of the nation's highest-volume retail brands exerts a massive downward mechanical pull on any aggregate index that samples pharmacy point-of-sale transaction amounts.
As KFF's Juliette Cubanski, one of the independent experts quoted in the Associated Press coverage of the release, cautioned, "I don't think we can attribute this price reduction to any one specific policy change or initiative." But when the largest payer programs in the country implement mandatory price cuts across billions of dollars of claims on January 1, that downward shift inevitably manifests in national macroeconomic transaction indices over the subsequent 6 to 12 months.
Furthermore, these price drops compound the ongoing biosimilar market penetration in immunology. The entry and expanding formulary adoption of Stelara biosimilars throughout 2025, alongside continued price competition in the adalimumab (Humira) market, drove significant brand-to-biosimilar switching at discounts ranging from 50% to 85% off reference WAC.
Why the MFN deals and TrumpRx are unlikely to be in this number yet
The Trump administration’s public statement credited its executive initiatives—specifically Most Favored Nation (MFN) pricing commitments and TrumpRx—for delivering the 3.1% decline. However, a technical analysis of how these initiatives operate demonstrates that they cannot account for the July 2026 CPI reading.
POLICY MECHANISM VS. CPI CHANNEL FIT
| Executive Initiative | Structural Channel Limitation for July 2026 CPI |
|---|---|
| **MFN Pricing Framework** | • Voluntary agreements with 17 manufacturers • Contracts remain unpublished and non-binding • CMS demonstration models not yet implemented • Zero change in standard commercial PBM contracts |
| **TrumpRx Platform** | • Direct cash-pay platform for self-pay patients • Completely outside insured pharmacy benefit flow • Stores no patient or prescription volume data • Average savings estimated at ~$5/user by Senate |
1. The Most Favored Nation (MFN) Framework
In late 2025 and 2026, the administration announced that 17 pharmaceutical companies—representing approximately 86% of the branded drug market—had agreed to align U.S. prices with international lowest-price benchmarks.
However, as Vanderbilt University health policy professor Dr. Stacie Dusetzina and Harvard Medical School researcher Dr. Benjamin Rome have documented, these announcements represent high-level policy frameworks and voluntary manufacturer pledges rather than operational regulations:
The specific underlying contracts between manufacturers and the Department of Health and Human Services (HHS) remain confidential and unpublished.
Center for Medicare and Medicaid Innovation (CMMI) demonstration models required to codify MFN pricing across Medicare Part B or Part D have not completed notice-and-comment rulemaking.
Commercial health plans and PBMs have not modified their commercial provider reimbursement contracts based on MFN announcements.
In congressional testimony, CMS Administrator Mehmet Oz acknowledged that the voluntary MFN arrangements expire at the conclusion of the presidential term, confirming that permanent statutory pricing adjustments have not taken effect.
2. TrumpRx and Cash-Pay Channel Architecture
The White House release asserted that the TrumpRx platform had generated over "$700 million in consumer savings," including offering GLP-1 medications starting at $149 per month.
On August 13, 2026, U.S. Senator Elizabeth Warren released a formal oversight letter addressed to HHS Secretary Robert F. Kennedy Jr., analyzing the operational structure of the TrumpRx platform and PBM real-time benefit tools. The inquiry established critical data realities:
No Centralized Claims Tracking: The TrumpRx portal functions as a search and routing aggregator for third-party cash-discount cards and manufacturer direct-pay programs. The platform itself does not process or store individual patient health, prescription, or claims data, rendering the administration's $700 million aggregate savings figure statistically unverifiable from government administrative records.
Volume Limitations: When normalized across the estimated user base, the claimed savings represent only about $5 per average prescription drug user, in Warren's calculation—a consumer benefit, but a negligible fraction of the $450+ billion annual U.S. prescription drug market.
Out-of-Network Nature: The vast majority of CPI prescription drug data is sampled from standard commercial and Medicare Part D claims adjudicated through pharmacy management systems. Cash-discount card transactions sit outside standard insured benefits and do not alter the baseline transaction prices recorded for insured lives.
The one administration initiative that did possess an operational pricing mechanism inside the index window was the Medicare GLP-1 Bridge Program, which launched on July 1, 2026, capping patient copayments at $50 per month for qualifying Part D beneficiaries through December 2027 (see our detailed guide on the Medicare GLP-1 Bridge Program). Because July was the first active month of the Bridge program, it provided a modest downward contribution to the -0.8% July single-month move, but it cannot explain the cumulative 3.1% annual drop that built across late 2025 and early 2026.
What this index cannot tell you about what patients pay
The publication of a record 3.1% drop in prescription drug prices was met with widespread skepticism by ordinary consumers, many of whom reported that their out-of-pocket prescription expenses had increased over the past year.
This divergence is not a statistical illusion; it is the natural consequence of how benefit design and cost-sharing interact with aggregate price indices.
                      WHY PATIENT OUT-OF-POCKET COSTS DIVERGE FROM CPI

      Aggregate Pharmacy Reimbursement (CPI)             Patient Out-of-Pocket Experience
   ┌──────────────────────────────────────────┐      ┌──────────────────────────────────────────┐
   │                                          │      │                                          │
   │  Total transaction price paid to pharmacy│      │  • Deductibles reset each January        │
   │  falls due to statutory price caps       │      │  • Coinsurance % on specialty tiers      │
   │  and generic/biosimilar substitution     │      │  • PBM formulary tier shifting           │
   │                                          │      │  • Higher monthly insurance premiums     │
   │                                          │      │                                          │
   │         ▼  FALLING 3.1% IN CPI           │      │         ▲  STABLE OR RISING OUT-OF-POCKET│
   └──────────────────────────────────────────┘      └──────────────────────────────────────────┘
1. The Deductible and Coinsurance Trap
When a patient is enrolled in a High-Deductible Health Plan (HDHP) or a Medicare Part D plan with coinsurance, their out-of-pocket payment is determined by benefit phase and tier placement. If a drug's retail transaction price drops from $800 to $600, an uninsured patient paying full cash saves $200. But for an insured patient who must meet a $2,000 annual deductible before insurance kicks in, they still pay 100% of the cost until the deductible is satisfied.
Furthermore, if a health plan responds to manufacturer list price changes by shifting a brand from Tier 3 (fixed $45 copay) to Tier 4 (35% coinsurance), the patient's out-of-pocket payment on a $600 medication jumps from $45 to $210—a 366% increase for the patient, even while the total transaction price captured by BLS fell by 25%.
2. Premium Offsets in Part D Redesign
Under the Medicare Part D redesign for 2025 and 2026, Congress established an absolute $2,000 annual cap on beneficiary out-of-pocket drug costs. While this delivers life-changing financial relief to high-cost patients with cancer, multiple sclerosis, or autoimmune diseases, Part D plan sponsors responded to their increased risk liability by raising standard plan premiums and tightening utilization management (step therapy and prior authorizations). Patients whose total annual drug spending was already below $2,000 saw little direct copay reduction, but experienced higher monthly premiums.
3. CPI-U vs. Medicaid Inflation Rebates
Biopharma analytics teams should also distinguish the general CPI prescription drug index from the overall CPI-U (Consumer Price Index for All Urban Consumers) used across statutory drug programs. Under the Medicaid Drug Rebate Program (MDRP), manufacturers must pay an additional statutory inflation penalty rebate if a drug's Average Manufacturer Price (AMP) increases faster than general CPI-U.
The prescription drug sub-index falling 3.1% does not alter the general CPI-U inflation benchmark used for Medicaid additional rebates or IRA Part B/Part D inflation penalties; it represents a specific commodity sub-index tracking pharmacy transaction dynamics.
Data-Integrity Notice: BLS News Release vs. Timeseries API
For biopharma commercial analytics, health economics and outcomes research (HEOR), and market-access forecasting teams, a critical technical finding regarding data integrity must be noted.
In conducting reproducible validation of the July 2026 data, analysts examined both the canonical published BLS News Release tables and the public BLS Timeseries API (api.bls.gov/publicAPI/v2/timeseries/data for series CUUR0000SEEE01 and CUSR0000SEEE01).
[!WARNING] Data Pipeline Discrepancy: The public BLS timeseries API returns raw index values for series
CUUR0000SEEE01that contradict the official news release tables (returning July 2026 index 36.641 vs. July 2025 index 35.273, implying an unadjusted +3.9% increase, alongside a missing observation for October 2025).Healthcare analytics teams and corporate reporting desks must cite the official BLS News Release tables (Tables 2, 6, and 7)—which are internally consistent, audited, and form the legal and journalistic basis of the historical record—and avoid unadjusted queries to the public timeseries API until BLS updates its automated API endpoint pipeline.
What to watch in the August and September CPI releases
As the pharmaceutical industry moves into the second half of 2026, several upcoming catalysts will determine whether the 3.1% annual price decline represents a temporary inflection or a permanent structural deflation in prescription drug spending:
August and September 2026 CPI Reports (Releasing Mid-September & Mid-October): These releases will measure the second and third months of the Medicare GLP-1 Bridge Program ($50 copay) and capture late-summer generic launches. If the 12-month series remains below -3.0%, it will confirm that IRA price effectuation has permanently shifted baseline pharmacy reimbursement levels.
Initial Price Applicability Year 2027 Negotiations: CMS announced negotiated prices for the second cycle of 15 Part D drugs in late 2025, scheduled to take effect on January 1, 2027. When those 15 additional blockbuster therapies (including Austedo, Linzess, and Xtandi) enter the price ceiling regime, another wave of point-of-sale reimbursement compression will hit the index.
PBM Formulary Removals for 2027: Major PBMs (CVS Caremark, Express Scripts, OptumRx) publish their 2027 commercial formulary exclusion lists in August and September 2026. Watch for widespread exclusion of high-WAC reference biologics in favor of low-WAC biosimilars, which directly lowers the transaction amounts sampled by BLS.
Frequently Asked Questions
Did prescription drug prices really fall 3.1 percent in a year?
Yes. According to official tables in the U.S. Bureau of Labor Statistics (BLS) Consumer Price Index report for July 2026, the prescription drug sub-index declined 3.1% over the 12 months from July 2025 to July 2026 and fell 0.8% in the month of July — both not seasonally adjusted, since BLS publishes the prescription drugs series NSA only. BLS Table 7 confirmed this was the largest 12-month drop in the series since March 1963 (-3.2%).
Is the monthly 0.8 percent drop seasonally adjusted?
No. BLS publishes the prescription drugs index on a not-seasonally-adjusted basis only, so both the -0.8% June-to-July move and the -3.1% 12-month change are unadjusted figures (the release's Table 2 and Table 6 footnotes flag this). Analysts comparing drug CPI moves across Januaries, when deductibles reset and new plan-year prices land, should keep that in mind.
Does the CPI drug index reflect what I pay at the pharmacy counter?
Not directly. The CPI index measures the total transaction amount received by the pharmacy, combining the patient's out-of-pocket copay and the insurance company's reimbursement. If a government policy or generic competitor lowers the total price a pharmacy receives from $800 to $400, the index drops 50% even if your insurance plan keeps your personal copay at $40.
Is the drop caused by Trump's most-favored-nation deals?
Independent health policy experts say no. The administration's Most Favored Nation (MFN) agreements with 17 drugmakers are voluntary frameworks whose underlying contracts remain unpublished, and the necessary CMS demonstration regulations have not been implemented in standard commercial pharmacy dispensing. The timeline of the decline aligns directly with statutory IRA price caps that took effect on January 1, 2026.
Do Medicare negotiated prices affect the CPI prescription-drug index?
Yes, significantly. On January 1, 2026, Maximum Fair Prices took effect for the top 10 highest-spend Medicare Part D drugs, reducing point-of-sale pharmacy reimbursement by 38% to 79%. Because Medicare Part D accounts for roughly 30% of U.S. retail prescription volume and a somewhat larger share of retail drug spending, an overnight 38%-to-79% reduction on these blockbuster drugs mechanically pulls down national price indices.
Why can drug prices fall in the CPI while my costs go up?
If your health plan raises your annual deductible, switches your medication from a flat copay tier to a percentage coinsurance tier, or raises monthly plan premiums, your personal out-of-pocket spending will increase even as the total point-of-sale price captured by government statistics declines.
When was the last time drug prices fell this much, and what happened then?
The last time the prescription drug CPI fell by more than 3% in a 12-month period was March 1963 (-3.2%). That historical decline followed the passage of the landmark Kefauver-Harris Drug Amendments of 1962, which fundamentally transformed FDA drug safety and efficacy regulations and restructured the pharmaceutical market.
Sources
U.S. Bureau of Labor Statistics (BLS) — Consumer Price Index News Release – July 2026 Results (Tables 2, 6, and 7). Published August 12, 2026. Available at: bls.gov/news.release/cpi.htm.
U.S. Bureau of Labor Statistics — BLS Handbook of Methods: Consumer Price Index (data sources and calculation of prescription drug indexes). Available at: bls.gov/opub/hom/cpi/home.htm.
Centers for Medicare & Medicaid Services (CMS) — Medicare Drug Price Negotiation Program: Negotiated Prices for Initial Price Applicability Year 2026. Published August 2024; prices effective January 1, 2026. Available at: cms.gov/newsroom/fact-sheets/medicare-drug-price-negotiation-program-negotiated-prices-initial-price-applicability-year-2026.
The White House — President Trump Delivers Largest Prescription Drug Price Drop in Over 60 Years. Office of the Press Secretary, August 2026. Available at: whitehouse.gov/releases/2026/08/president-trump-delivers-largest-prescription-drug-price-drop-in-over-60-years.
U.S. Senator Elizabeth Warren — Follow-Up Letter to HHS Secretary Robert F. Kennedy Jr. Regarding MFN Drug Pricing Deals and TrumpRx Operational Transparency. August 13, 2026. Available at: warren.senate.gov/wp-content/uploads/2026/08/2026.8.13-Follow-Up-Letter-to-Secretary-Kennedy-Releasing-MFN-Deals.pdf.
Associated Press / Los Angeles Times — Trump Claims Credit as Prescription Drug Prices See Steepest Drop Since 1963. Published August 18, 2026. Available at: latimes.com/business/story/2026-08-18/trump-claims-credit-as-prescription-drug-prices-see-steepest-drop-since-1963.
Centers for Medicare & Medicaid Services (CMS) — Medicare Part D Manufacturer Discount Program & Benefit Redesign Implementation Guidance. Available at: cms.gov/medicare/prescription-drug-coverage/medicarerxgeninfo.