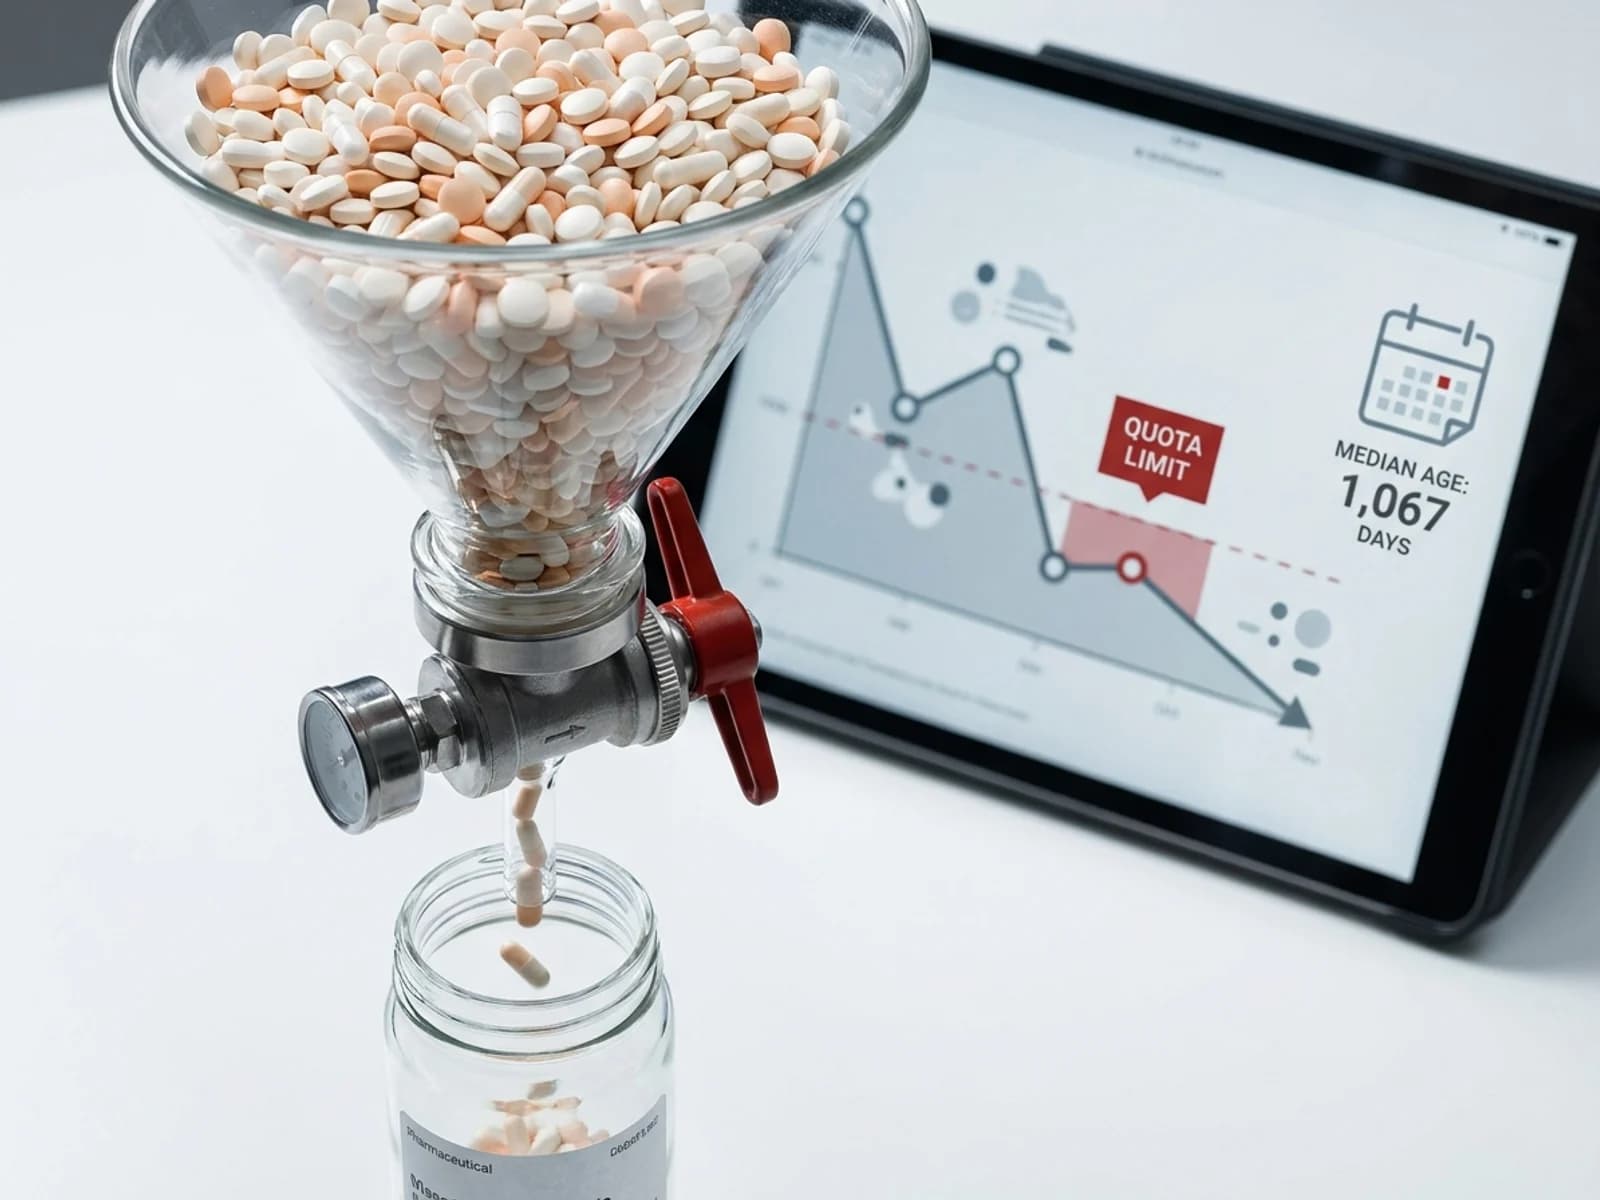
The FDA enforcement report database contains 17,683 drug recall events spanning 2011 to 2026. Of those, 80.6% are Class II — meaning exposure to the violative product may cause temporary or medically reversible adverse health consequences. Sterility and contamination concerns account for 40% of all recalls. And a single contract packager, Aidapak Services, accounts for 538 events — more than any pharmaceutical manufacturer in the dataset.
This analysis is drawn from the FDA drug recall enforcement reports, which document all recalls monitored by the agency, classified as Class I, II, or III under 21 CFR 7.50. The database records each recall event individually: a single product with multiple lots or NDCs generates multiple entries. The 17,683 records analyzed here represent all drug recalls with a recorded initiation date.
Classification: the severity breakdown
| Classification | Count | Share | Definition |
|---|---|---|---|
| Class II | 14,261 | 80.6% | Temporary or medically reversible health consequences |
| Class I | 1,727 | 9.8% | Reasonable probability of serious health consequences or death |
| Class III | 1,695 | 9.6% | Unlikely to cause adverse health consequences |
Class II dominates at 80.6%, a share that has held remarkably steady across the full time series. Class I events — the most dangerous — represent roughly 1 in 10 recalls. That proportion spiked in 2018, when 554 of 1,681 recalls (33%) were Class I, driven largely by a wave of sterility-related recalls from compounding pharmacies and outsourcing facilities following intensified FDA inspection of 503B operations.
Class III recalls, while the least hazardous, often signal labeling or packaging issues that can cascade into supply-chain disruption when they affect high-volume generic products.
The year-by-year trend
| Year | Total recalls | Class I | Class II | Class III |
|---|---|---|---|---|
| 2011 | 34 | 5 | 21 | 8 |
| 2012 | 534 | 49 | 401 | 84 |
| 2013 | 2,085 | 112 | 1,803 | 170 |
| 2014 | 1,309 | 125 | 1,055 | 129 |
| 2015 | 1,733 | 127 | 1,464 | 142 |
| 2016 | 1,199 | 63 | 966 | 170 |
| 2017 | 1,141 | 83 | 893 | 165 |
| 2018 | 1,681 | 554 | 982 | 145 |
| 2019 | 1,788 | 50 | 1,586 | 152 |
| 2020 | 930 | 128 | 708 | 94 |
| 2021 | 1,152 | 124 | 921 | 107 |
| 2022 | 1,391 | 98 | 1,207 | 86 |
| 2023 | 1,122 | 86 | 948 | 88 |
| 2024 | 557 | 70 | 411 | 76 |
| 2025 | 778 | 45 | 676 | 57 |
| 2026 (partial) | 242 | 5 | 215 | 22 |
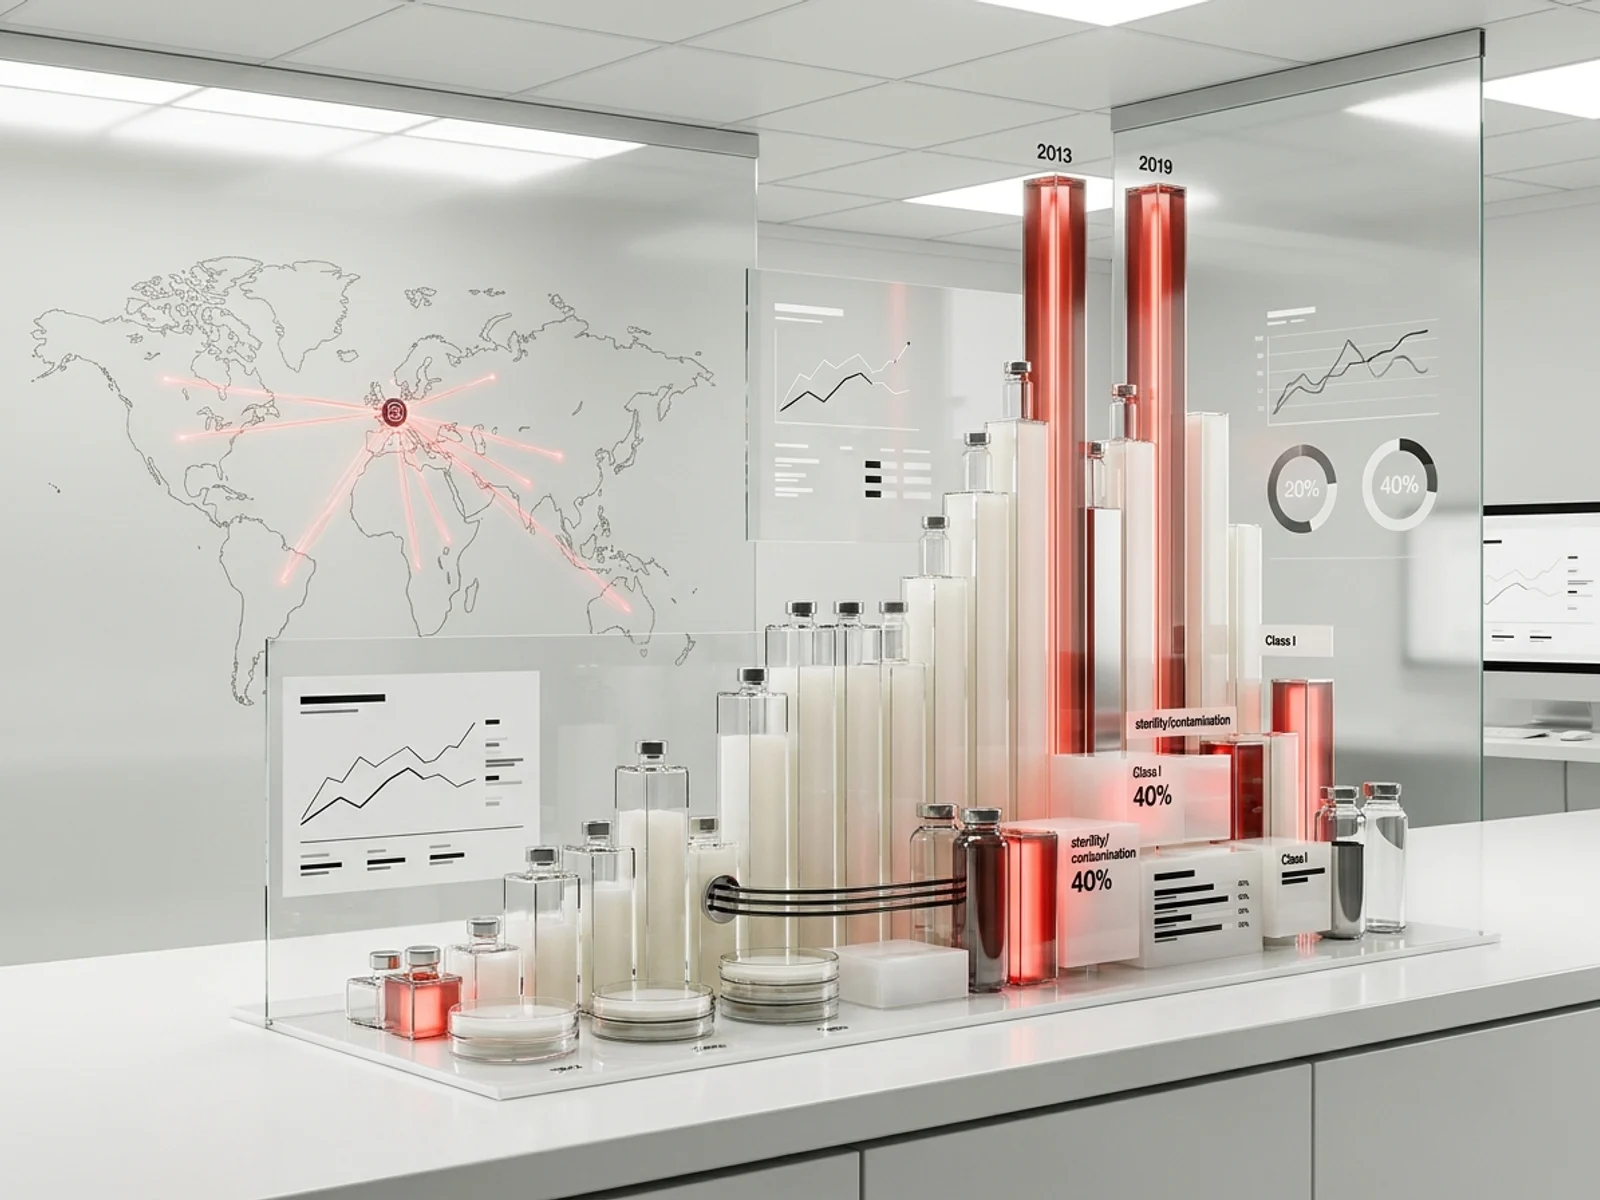
Two structural peaks stand out: 2013 (2,085 recalls) and 2019 (1,788). The 2013 peak was driven by large-scale compounding pharmacy enforcement actions — including the aftermath of the New England Compounding Center fungal meningitis outbreak that killed 64 people in 2012. The 2019 peak reflects a second wave of FDA action against compounding and outsourcing facilities, combined with a surge of nitrosamine impurity recalls that began in mid-2018 and continued through 2020.
Recall volume declined significantly after 2022, dropping to 557 in 2024 before partially rebounding to 778 in 2025. The 2024 figure is the lowest annual total since 2012, though the 2026 partial-year rate suggests a return to pre-2020 levels.
Why drugs are recalled
| Reason category | Count | Share |
|---|---|---|
| Sterility/contamination concerns | 7,072 | 40.0% |
| CGMP deviations | 3,399 | 19.2% |
| Labeling errors | 1,543 | 8.7% |
| Impurity (nitrosamine or other) | 1,482 | 8.4% |
| Stability/degradation failures | 795 | 4.5% |
| Cross-contamination | 721 | 4.1% |
| Particulate matter | 716 | 4.0% |
| Potency/dissolution failures | 335 | 1.9% |
| Packaging defects | 267 | 1.5% |
| Temperature/storage | 48 | 0.3% |
| Other | 1,305 | 7.4% |
Sterility and contamination account for 40% of all recalls — the single largest driver by a wide margin. The most common specific reason in the dataset is "lack of assurance of sterility" (3,158 events), a phrase that appears when an FDA inspection calls a facility's sterile manufacturing controls into question, even without confirmed microbial contamination. This is distinct from confirmed microbial contamination (465 events), where testing has identified organisms in the product.
CGMP deviations (19.2%) represent the second-largest category. These range from environmental monitoring failures and media-fill test violations to data integrity lapses and inadequate investigations into out-of-specification results.
The nitrosamine impurity wave (1,482 events, 8.4%) represents one of the most concentrated regulatory events in recent pharmaceutical history. Beginning with the July 2018 valsartan recall, the nitrosamine crisis expanded to ranitidine (Zantac), metformin, rifampin, and numerous other drug classes, generating hundreds of individual recall events as manufacturers tested and retested their portfolios.
Class I recalls: what is most dangerous
Among Class I recalls initiated between 2023 and 2026, the reason profile shifts:
| Class I reason (2023–2026) | Count |
|---|---|
| Other/uncategorized | 87 |
| Sterility concerns | 66 |
| Particulate/foreign matter | 24 |
| Labeling error | 23 |
| Subpotency | 3 |
| CGMP deviations | 1 |
| Impurity/nitrosamine | 1 |
| Cross-contamination | 1 |
Sterility concerns remain the leading identified cause of Class I recalls, even in the most recent period. The "other" category (87) includes a mix of CGMP-related issues, defective containers, and product-specific contamination events that did not fit cleanly into the standard categories.
Who is recalling
| Company | Recall events | Share |
|---|---|---|
| Aidapak Services, LLC | 538 | 3.0% |
| Attix Pharmaceuticals | 470 | 2.7% |
| King Bio Inc. | 465 | 2.6% |
| The Compounding Pharmacy of America | 383 | 2.2% |
| Main Street Family Pharmacy, LLC | 299 | 1.7% |
| Central Admixture Pharmacy Services, Inc. | 274 | 1.6% |
| PharMedium Services, LLC | 246 | 1.4% |
| Cardinal Health Inc. | 213 | 1.2% |
| Franck's Lab Inc. | 198 | 1.1% |
| Teva Pharmaceuticals USA | 196 | 1.1% |
| Akorn, Inc. | 175 | 1.0% |
| Dr. Reddy's Laboratories, Inc. | 163 | 0.9% |
| McKesson Medical-Surgical Inc. | 157 | 0.9% |
| Glenmark Pharmaceuticals Inc., USA | 139 | 0.8% |
| Hospira Inc. | 138 | 0.8% |
The top three recalling firms are not traditional pharmaceutical manufacturers. Aidapak Services (538 events) is a contract packaging and distribution company whose recalls were largely driven by a single 2018 enforcement event involving penicillin cross-contamination across all repackaged products. Attix Pharmaceuticals (470 events) and King Bio (465 events) are homeopathic and OTC manufacturers whose recalls stemmed from CGMP violations and microbial contamination.
The first conventional pharmaceutical manufacturer on the list is Teva Pharmaceuticals USA (196 events), followed by Akorn (175) and Dr. Reddy's (163). Among sterile injectable manufacturers, Hospira (now Pfizer) recorded 138 events and PharMedium Services recorded 246.
Compounding pharmacies and outsourcing facilities are heavily represented. The Compounding Pharmacy of America (383), Main Street Family Pharmacy (299), Franck's Lab (198), and several others together account for a substantial share of all recall events — reflecting the structural quality challenges that led to the Drug Quality and Security Act of 2013 and the creation of the 503B outsourcing facility framework.
How firms learn about recalls
| Notification method | Count |
|---|---|
| Letter | 9,007 |
| Telephone | 2,706 |
| Press release | 2,571 |
| Multiple methods (email, fax, letter, press, telephone, visit) | 1,725 |
| 1,181 |
Letter notification remains the most common single method, but press releases (2,571) and multi-channel notifications (1,725) account for a combined 24% of events, suggesting that FDA and industry have moved toward broader public communication for higher-risk recalls.
Geographic distribution
Of 17,683 recall events, 16,636 (94.1%) originate in the United States. Canada (572 events, 3.2%) and India (250, 1.4%) are the next largest sources. Among US-based recalls, the geographic footprint is nationwide for 80% of events (14,189 of 17,683), reflecting the broad distribution patterns of large pharmaceutical wholesalers.
What this means for pharma manufacturers and supply chain teams
1. Sterility assurance is the persistent Achilles heel. With 40% of all recalls linked to sterility or contamination concerns, sterile manufacturing quality remains the single highest-impact area for regulatory risk. Facilities producing injectable products should expect continued FDA scrutiny of aseptic processing controls, environmental monitoring, and media-fill programs under the agency's increased inspection cadence in 2025–2026.
2. The nitrosamine wave has structural, not episodic, implications. The 1,482 impurity-related recalls demonstrate that the nitrosamine crisis was not a single event but a multi-year reassessment of pharmaceutical manufacturing inputs, solvents, and supply chains. Manufacturers should maintain validated methods for N-nitrosamine detection and conduct risk assessments across their full product portfolios, per the FDA's 2024 updated guidance on acceptable intake limits.
3. Compounding and outsourcing facilities remain high-risk. Multiple compounding pharmacies appear in the top-15 recalling firms, a pattern that has persisted since the 2012 NECC outbreak. Hospital systems sourcing from 503B outsourcing facilities should verify current FDA inspection status and consider dual-source strategies for critical compounded products.
4. Contract packagers and repackagers carry concentration risk. Aidapak Services' 538 recalls illustrate how a single contract facility's quality failure can cascade across hundreds of products from multiple sponsors. Sponsors should include recall-liability provisions in contract manufacturing and packaging agreements and conduct independent audits of repackaging facility controls.
5. Recall volume has declined but not the underlying risk. The drop from 1,788 recalls in 2019 to 557 in 2024 does not necessarily indicate improved manufacturing quality. FDA inspection frequency decreased during the COVID-19 pandemic, and the enforcement report captures only classified recalls — not warning letters, Form 483 observations, or consent decrees. The 2025 rebound to 778 events suggests the declining trend may be reversing.
Sources
- FDA drug recall enforcement reports, current edition; analysis by PharmaDossier, run date 2026-06-10. Enforcement data filtered by product type = Drugs. Classification and trend analysis computed from recall_initiation_date field. https://www.fda.gov/safety/recalls-market-withdrawals-safety-alerts/enforcement-reports
- FDA, "Enforcement Report Information and Definitions." https://www.fda.gov/safety/enforcement-reports/enforcement-report-information-and-definitions
- Reed Smith, "FDA Inspections in 2025: Heightened Rigor, Data-Driven Targeting and Increased Surveillance." https://www.reedsmith.com/articles/fda-inspections-in-2025-heightened-rigor-data-driven-targeting-and-increased-surveillance
- FDA, "Drug Quality and Security Act (DQSA)." https://www.fda.gov/drugs/drug-supply-chain-integrity/drug-quality-and-security-act-dqsa